

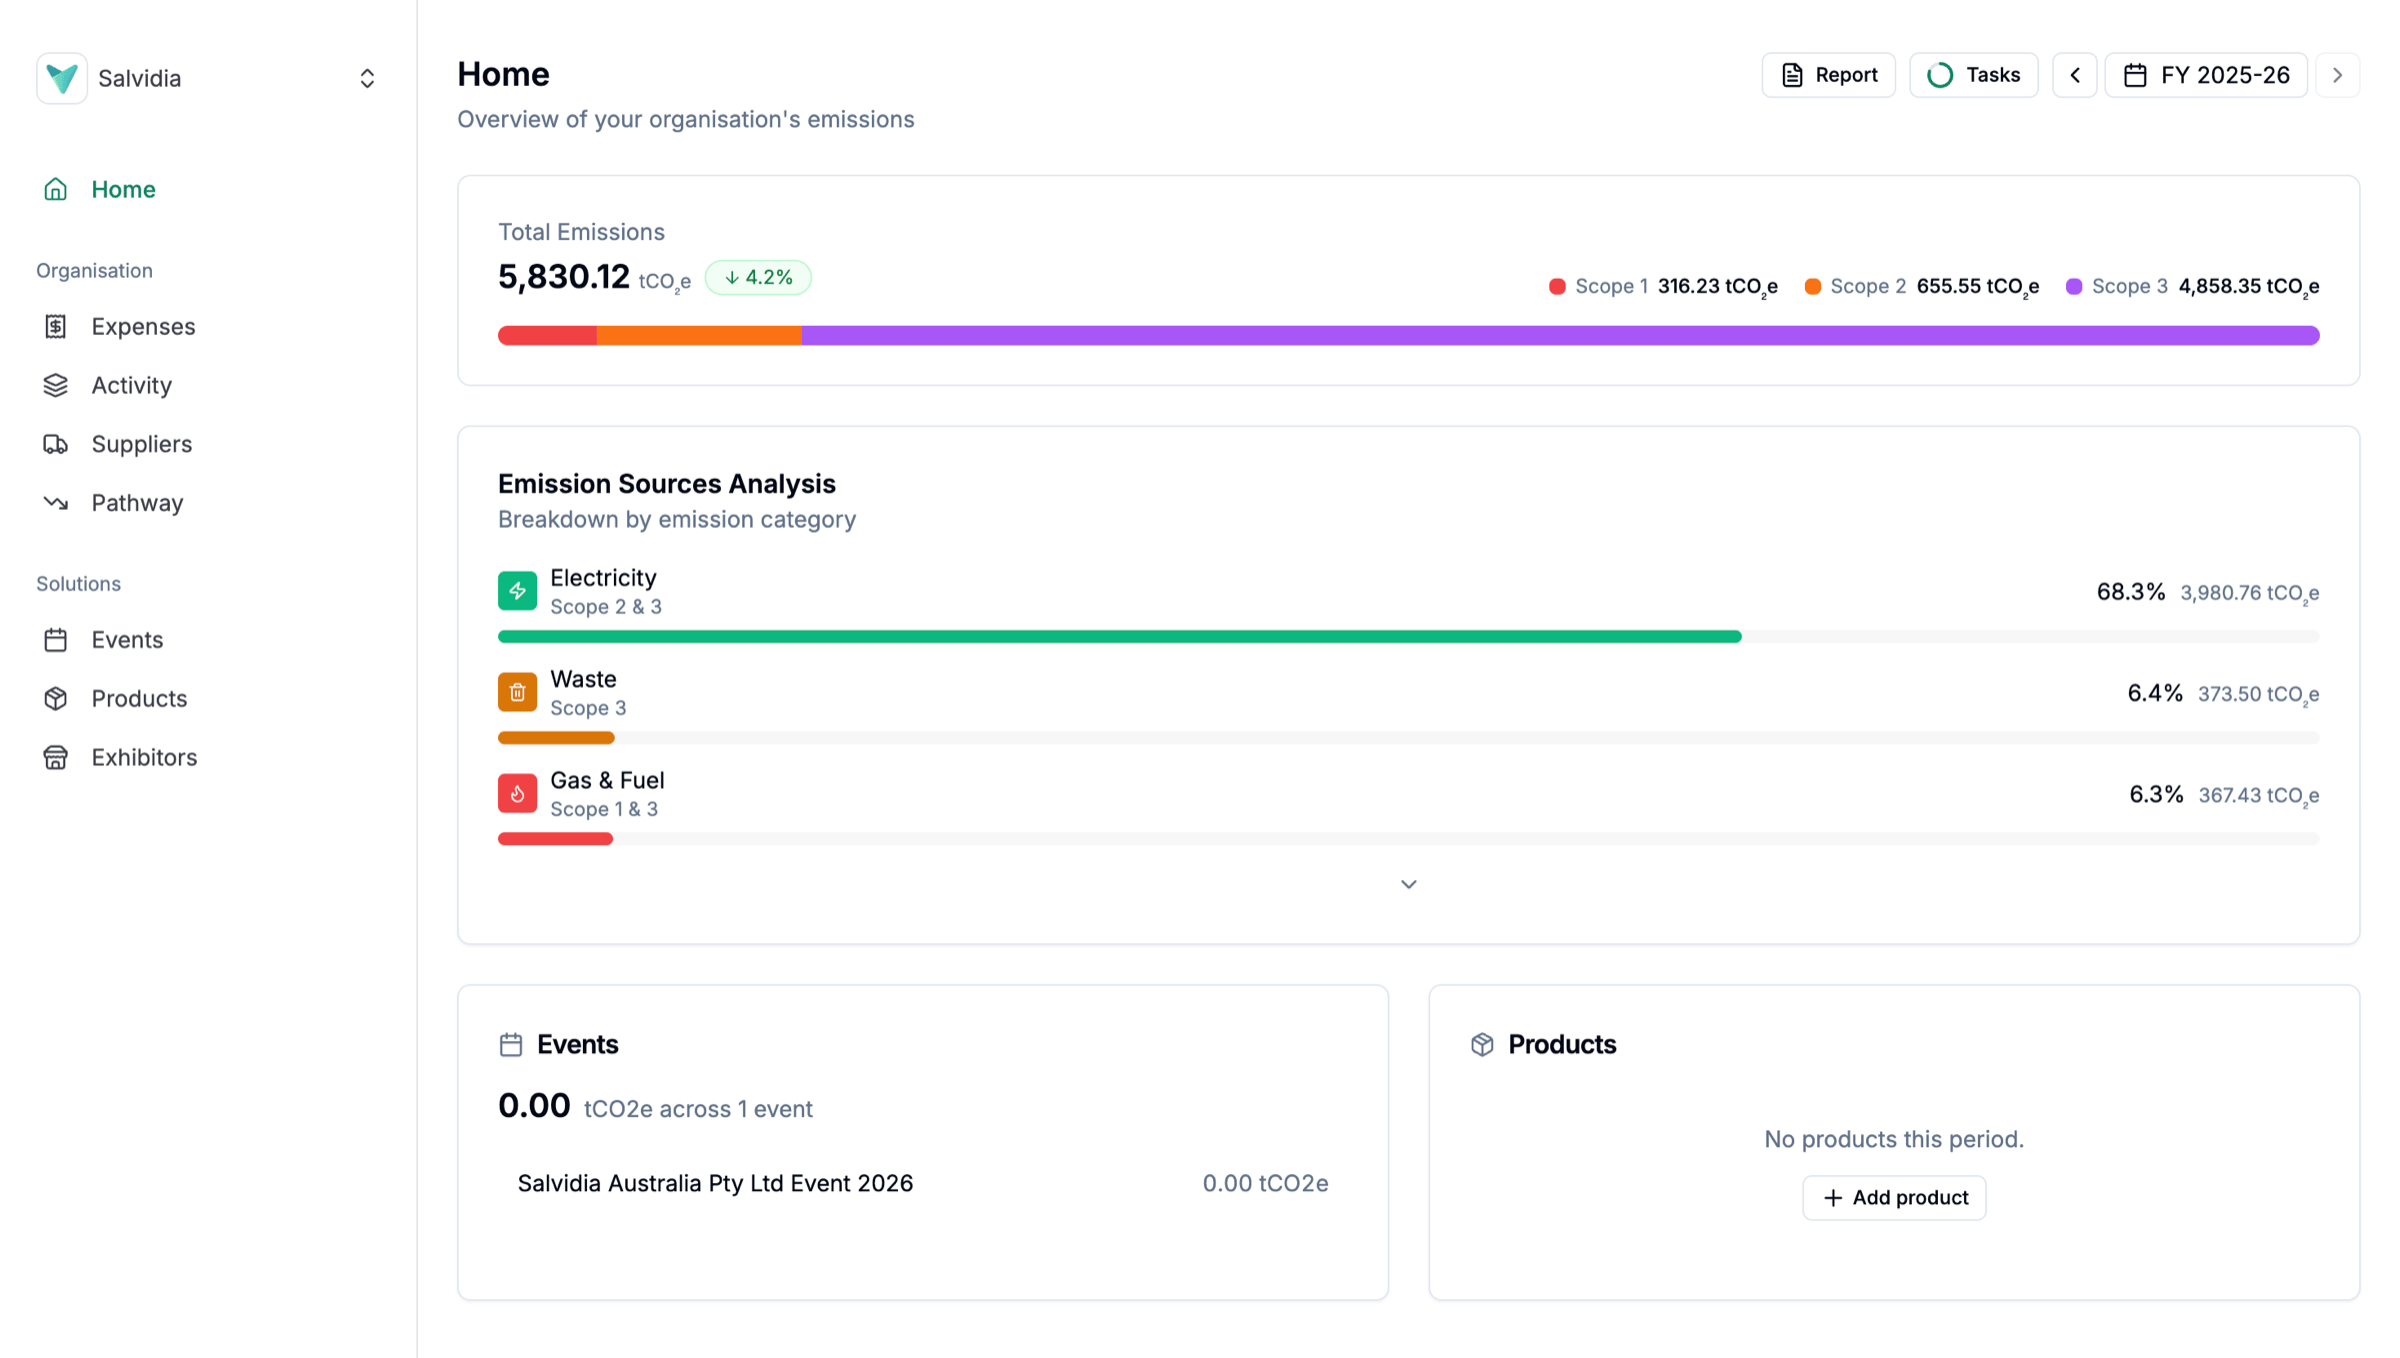
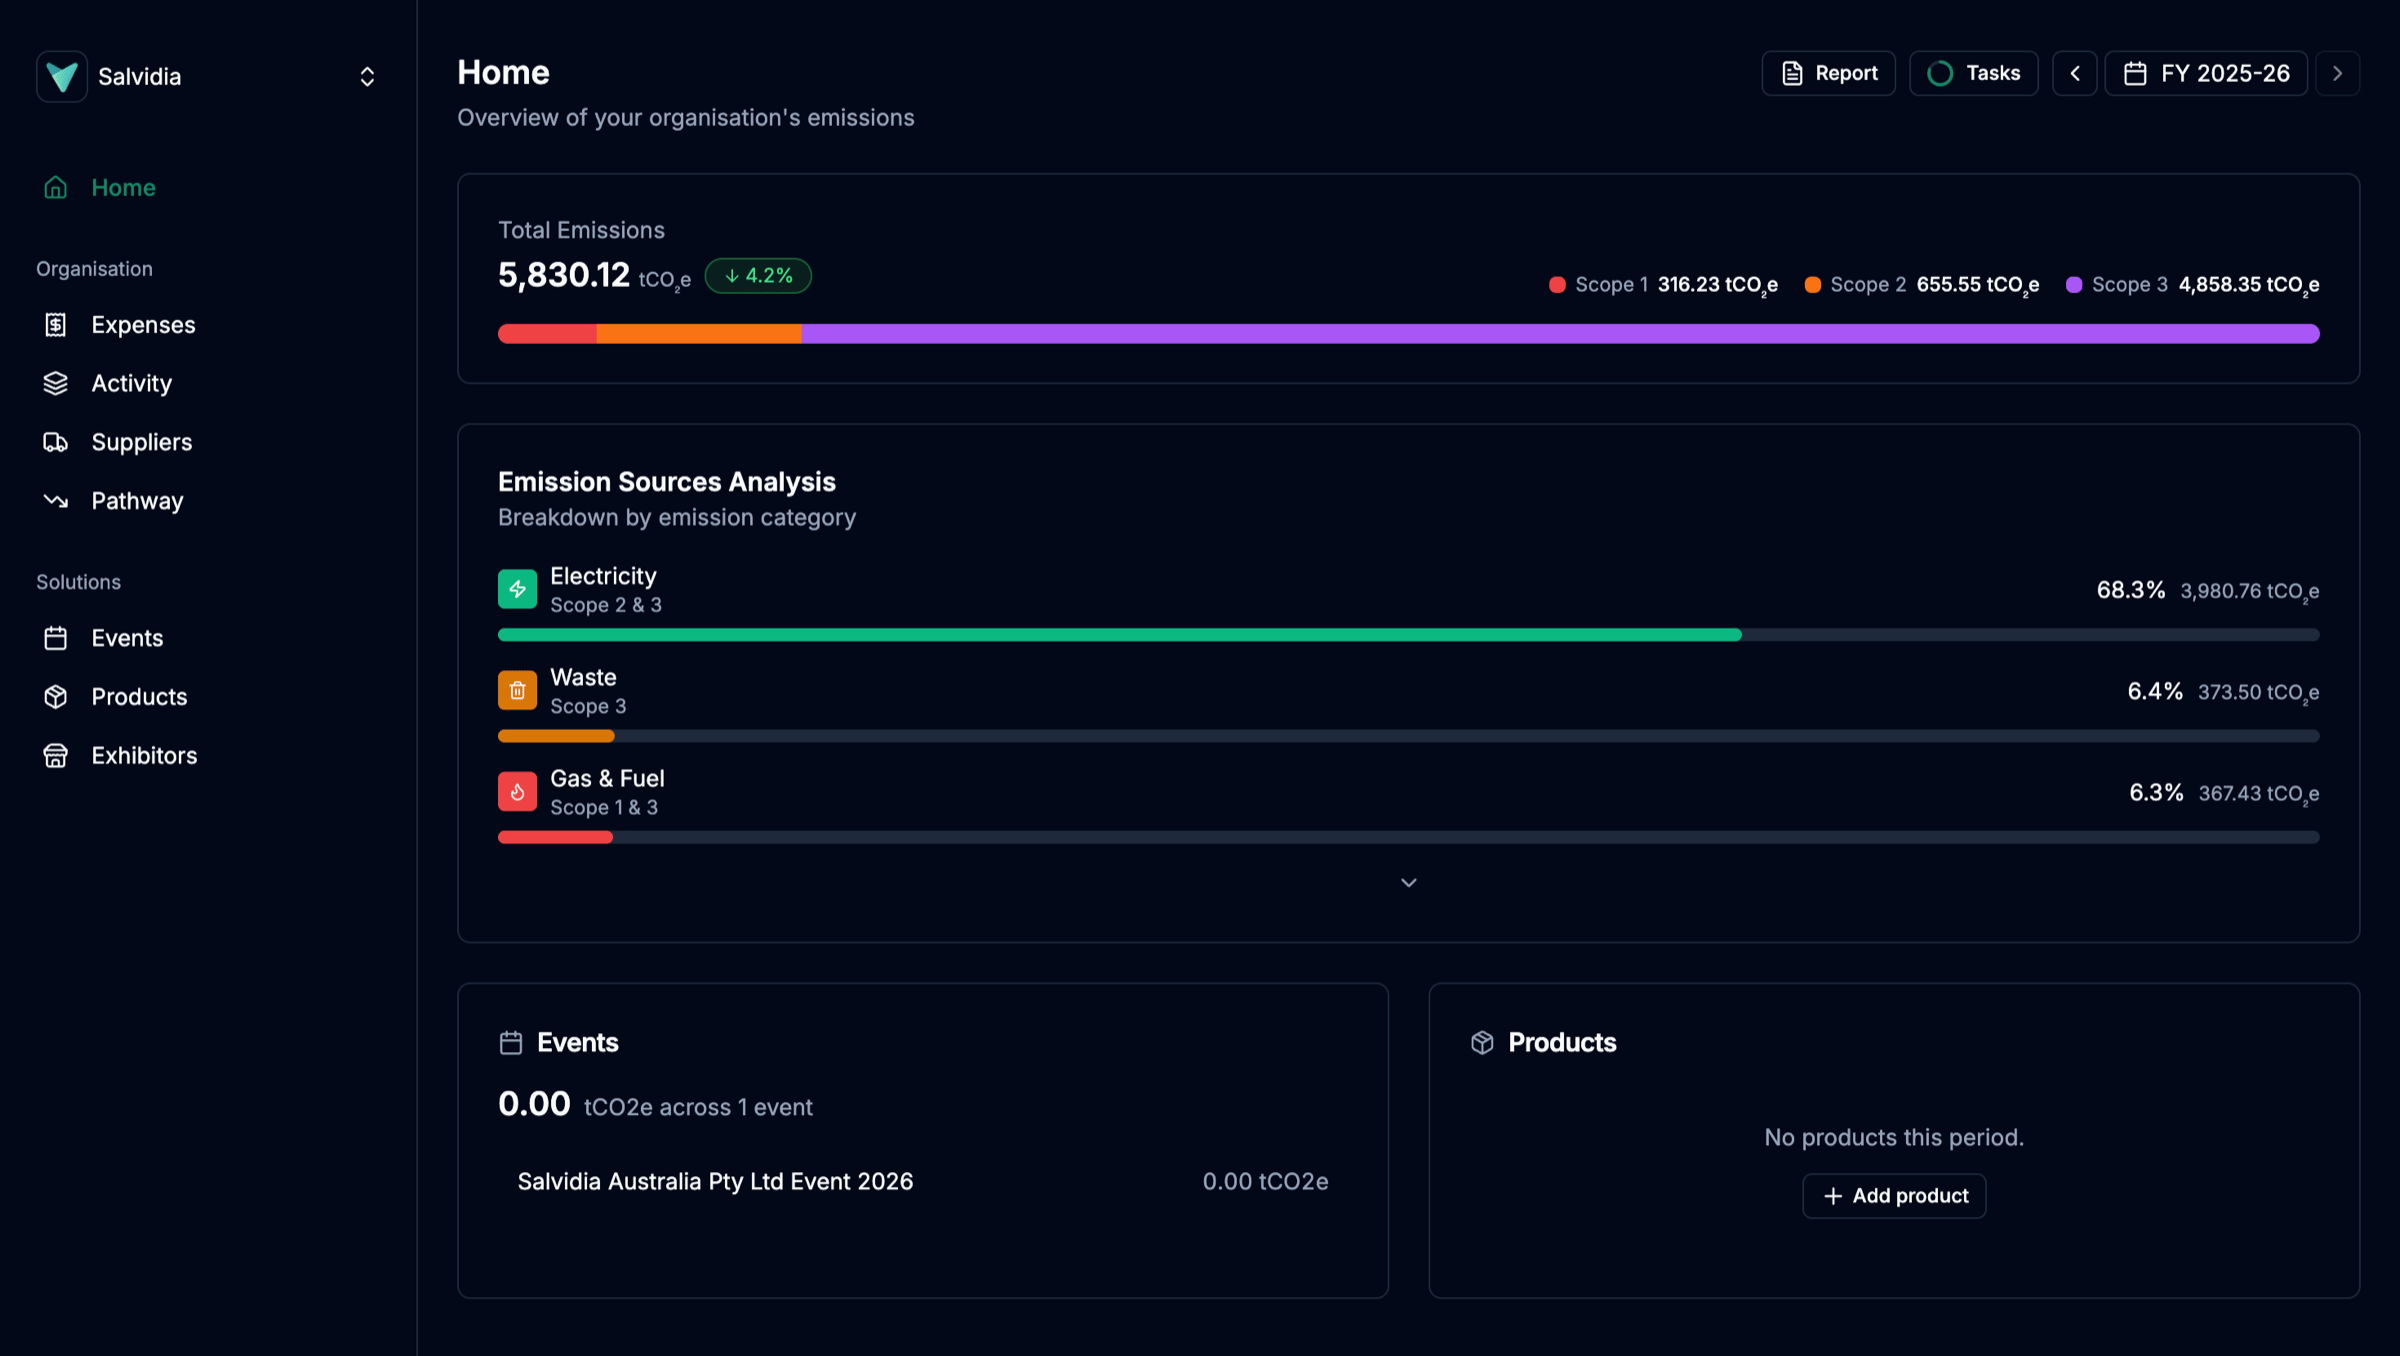
The Salvidia home dashboard: total emissions split by scope, with a breakdown of your largest emission sources.
Why teams use Salvidia
Start with whatever data you have. Connect your accounting platform for broad coverage in an afternoon, or enter kWh, litres, and tonnes directly. There is no minimum data set and nothing to install before you begin. Numbers that stand up to scrutiny. Every figure traces back to its underlying data and a published emission factor, ready for boards, clients, auditors, and reporting frameworks. Built for how Australia reports. GHG Protocol structure, local emission factors, and results that map onto ASRS-aligned disclosure. Win business with your footprint. Large customers increasingly ask suppliers for emissions data. A credible number, ready to share, is becoming a way to stand out and win work.How data gets in
Four paths, and most assessments use several of them:- Connect your accounting platform. Xero and other platforms give you broad Scope 3 coverage from spend, without weeks of collection.
- Enter activity data. Metered kWh, litres of fuel, tonnes of waste, kilometres travelled. This is what makes a category accurate.
- Use supplier figures. Where a supplier publishes real emissions data, it beats any industry average.
- Import a spreadsheet. Export from a utility portal, travel platform, or waste contractor and upload it.
What you can measure
Organisations
Your company’s complete footprint for a reporting period, across Scope 1, 2, and 3.
Events
Festivals, conferences, and productions, bounded by the event rather than a financial year.
Products
Life cycle footprints per unit, from materials through to end-of-life.
Explore the docs
Your first footprint
New to this? A six-lesson course that takes you from the request through to a finished, defensible number.
Getting started
Set up your workspace and run your first assessment end to end.
Using the platform
Assessment types, the data you’ll need, and how to read your results.
Carbon accounting guides
Scopes, boundaries, and the concepts behind your footprint, in plain language.
Methodology
The standards, calculations, and emission factors behind every number.
FAQ
Quick answers on accuracy, reporting requirements, and getting help.
Open Salvidia
Ready to go? Jump into the platform and start your first assessment.